Walk into every meeting with the numbers
Trends, scorecards and a board-ready report from your airport’s own flight history. Turn it on, and your history is already there. An optional module.
The questions you get asked
“How did we do last quarter?”
Pick the quarter and see flights, on-time rate, delays and cancellations, compared with the quarter before.
“Which airline or route is struggling?”
Airline and route scorecards show each carrier and destination side by side, and route health flags routes losing flights or running late.
“Are we getting better?”
The trend shows on-time performance day by day, across weeks, months, quarters or years.
“Can you send me something?”
A branded PDF in one click. Last month’s report also arrives in your inbox early each month.
A report your board will read
Choose a week, month, quarter or year, and Summit builds the report: an executive summary, the trend, a breakdown of delays, the airline and route scorecards, and your strongest days.
Branded PDF and spreadsheet
A polished report for meetings, and the raw numbers for your own analysis.
Always compared
Every figure sits beside the period before, so progress is obvious.
For the people you answer to
Board members, airline partners and city leaders get the same clear picture.
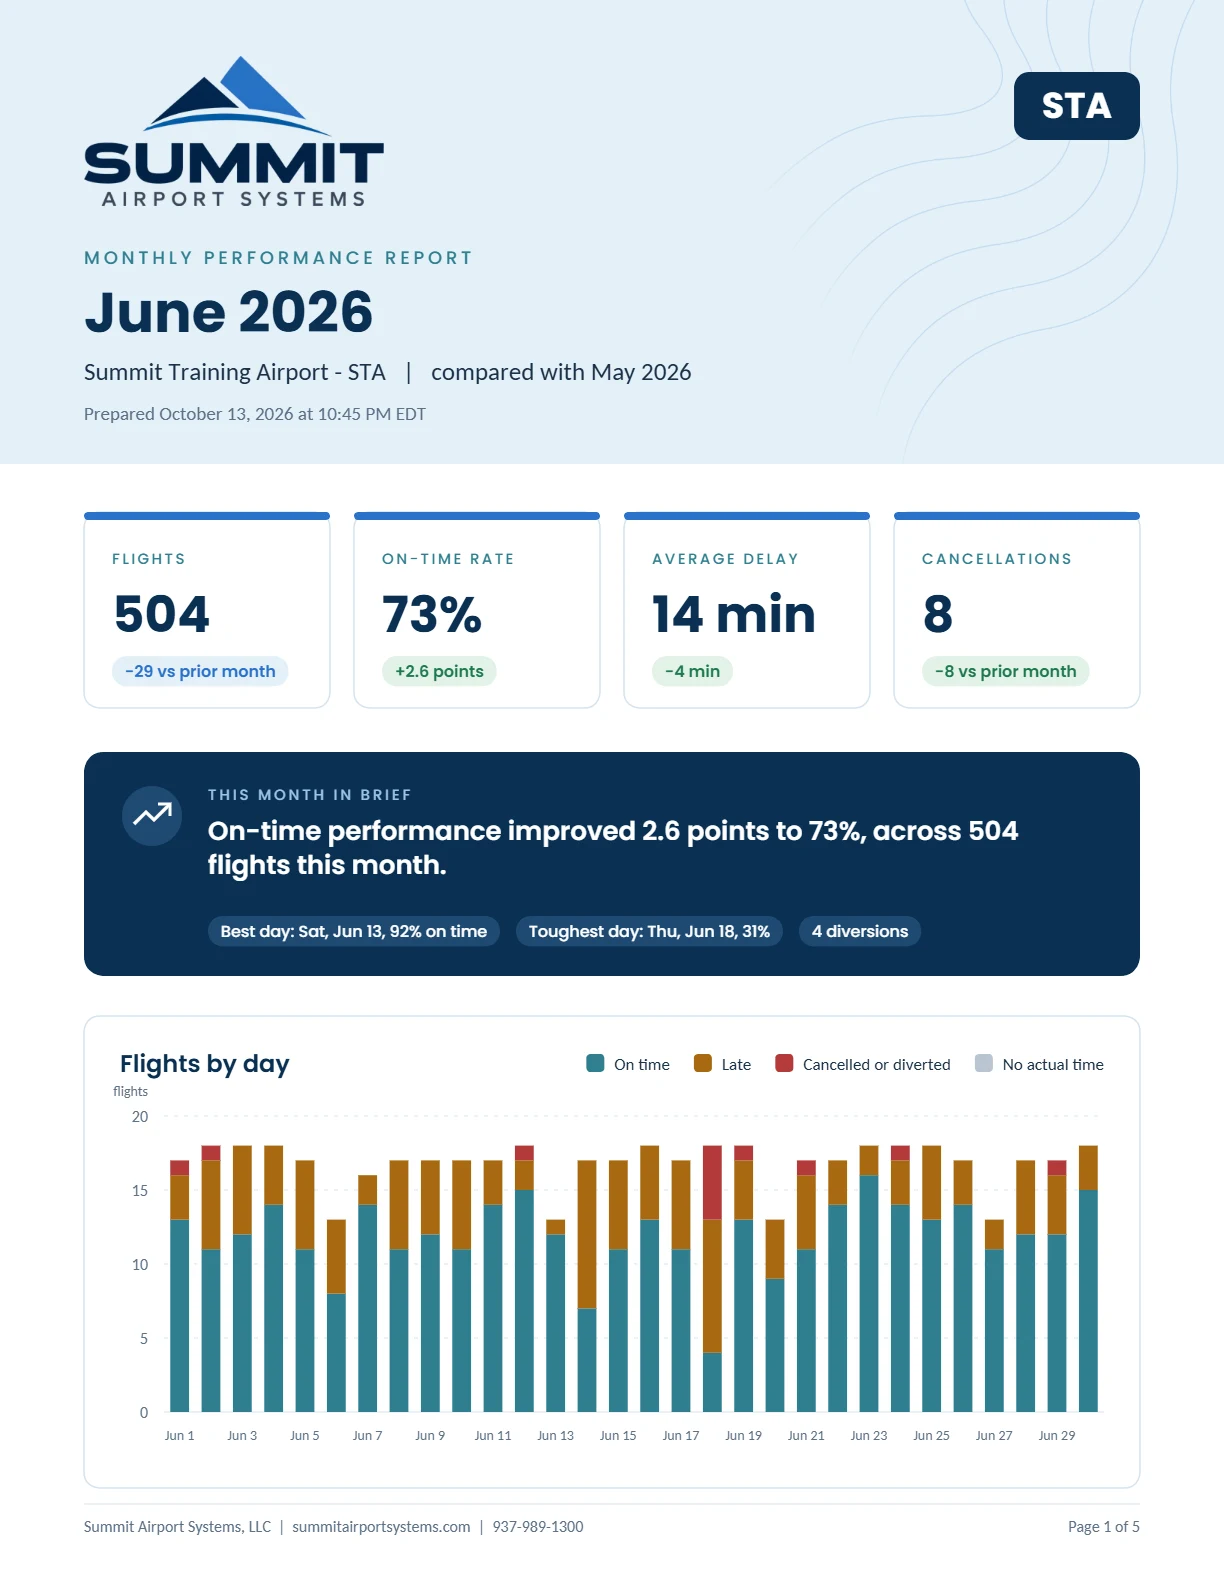
Your history is already there
Summit records every flight at your airport from the day you go live, with every subscription. Turn on reporting at any point, and your history is waiting: up to 13 months of flight-by-flight detail and five years of daily performance.
Know which routes need attention
Summit compares every route with the same weeks a year earlier and tells you which are growing, which are steady, and which need a closer look, with the date each change happened.
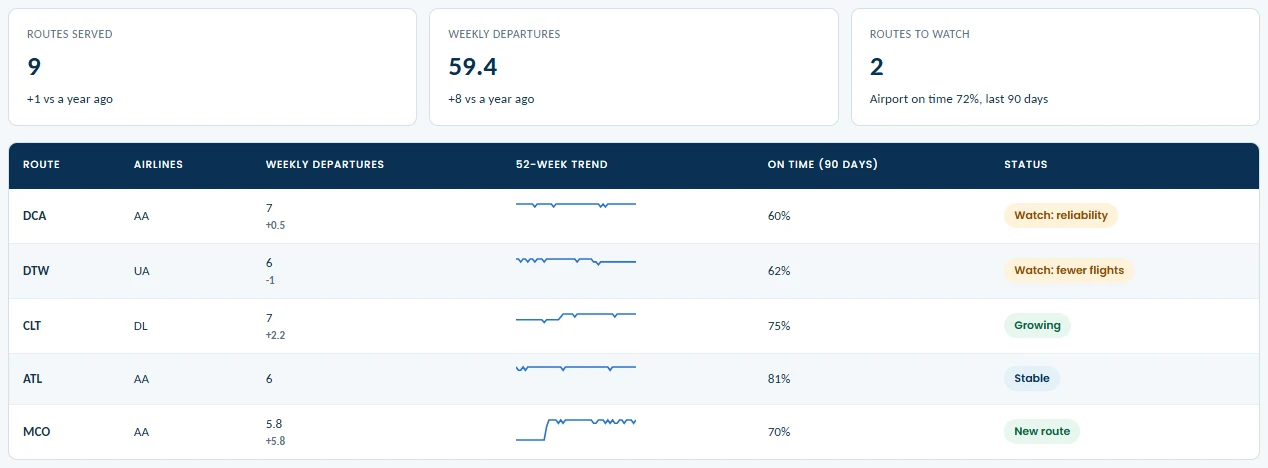
Portal shown with example flights from Summit’s training airport. Airline names are trademarks of their respective owners, shown for illustration only.
Spot a cut early
See when a route loses flights or a day of service stops, often before anyone announces it.
Know where you stand
Weekly departures and on-time performance for every route, beside the same weeks last year.
Make the case for service
A one-page brief for each airline, with its on-time record at your airport, its routes, and the gaps in your daily schedule, to bring to air service meetings.
The numbers come to you
Last month, in your inbox
Early each month, last month’s report arrives as a PDF, ready to forward to your board.
A heads-up when a route slips
An email when a route starts losing flights or running late, with what changed and when.
Sent to your airport’s administrators, who can turn either one off. Also included: gates and peak hours for staffing and gate planning, a year in review for your annual report, and period reports for a single airline or a single route.
Figures you can stand behind
Your definition of on time
You set the on-time threshold, and every report states it, along with the time zone and date range.
Every change on record
Each flight keeps its history: schedule changes and every correction your staff made.
Context, not blame
Airline and route figures are presented as context for conversations with your partners, not as fault-finding.
See your airport’s
numbers in a demo.
We’ll walk through the reports with real flights, and talk about the questions your board and airlines ask.